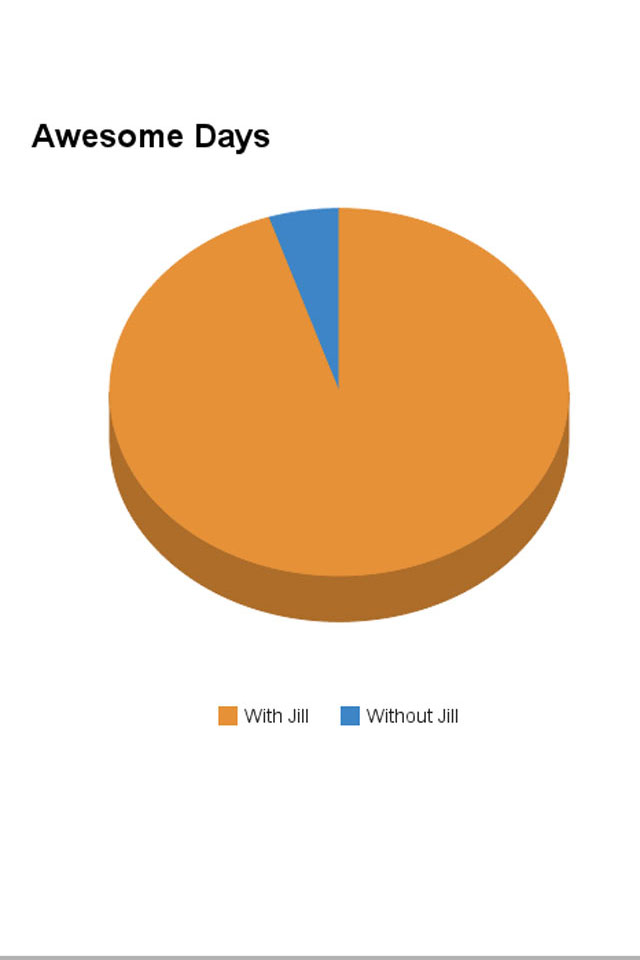
This should help explain.